Key findings
Five findings
162,369 ads from 300 institutions in Canada and the United States, collected October 2026.
5.9%
CE is a small share of what institutions advertise.
At the median institution with 20 or more ads, 5.9% of its ads come from its CE unit in Canada and 2.5% in the US. 191 of 299 institutions with an ad account ran at least one CE-unit ad.
7
A few institutions run half the ads.
7 of Canada's 85 CE advertisers run half of its CE-unit ads. In the US, 11 of 106 do. MIT alone runs 26% of US Data & AI ads.
29
Business is the most crowded field in every region.
29 institutions in the US South advertise Business programs, 15 in Ontario. Indigenous Knowledge has 7 advertisers across both countries.
38 of 39
Always-on advertisers in Canada run brand ads.
The units that never go quiet run brand ads alongside program ads: 38 of 39 in Canada, 52 of 66 in the US. 30 Canadian and 38 US institutions keep a brand ad running every month.
62%
Most CE advertisers are visible every month.
62% of US and 46% of Canadian CE advertisers had ads running in every month of the past year. The median CE-unit Google ad ran 372 days.
Finding 1 · Who advertises
CE is a small share of what institutions advertise.
191 of the 299 institutions with a verified ad account ran at least one ad from their continuing education unit. For most, that unit is a minor advertiser next to the rest of the institution.
At the median institution, CE-unit ads are a small share of its advertising.
Median share of an institution's ads that come from its CE unit · institutions with 20 or more ads · n = 94 Canada, 144 United States
5.9%
Canada · median institution
2.5%
United States · median institution
Institutions with 20 or more ads that ran no CE-unit ads at all
Source: CredScape ad collection, October 2026. Institutions with a verified account on Google, LinkedIn or Meta.
Your CE unit competes first inside its own institution's advertising. About a quarter of institutions with 20 or more ads ran none for CE. At the median, CE is one ad in seventeen in Canada and one in forty in the US.
Finding 2 · Concentration
A few institutions run half the ads.
Of the 85 Canadian institutions that ran CE-unit ads, 7 ran half of Canada's total. In the US, 11 of 106 ran half. Concentration holds inside subjects too.
Ten institutions run 63% of Canada's CE-unit ads and 49% of America's.
Share of CE-unit ads by advertiser rank · n = 4,313 Canada (85 advertisers), 12,604 United States (106 advertisers)
7
Canada · institutions running half of the country's CE-unit ads
11
United States · institutions running half of the country's CE-unit ads
Canada
85 advertisers · 7 run half the ads
Each circle represents one advertiser; 7 highlighted circles account for half of Canada’s CE-unit ads.United States
106 advertisers · 11 run half the ads
Each circle represents one advertiser; 11 highlighted circles account for half of United States’s CE-unit ads.Canada · 85 advertisers
United States · 106 advertisers
Source: CredScape ad collection, October 2026. Ads from CE-unit accounts on Google, LinkedIn and Meta.
If you compete with one of these schools for the same learners, you face a steady stream of ads. MIT alone runs 26% of US Data & AI CE-unit ads. UBC Vancouver runs about 30% of Canada's Data & AI, IT and Leadership ads. The top-ten lists are in Table A3.
Finding 3 · Geography
Western Canada advertises most.
41 of 50 institutions in BC, Alberta, Saskatchewan and Manitoba advertise their CE unit. Ontario is at 65% and Atlantic Canada at 23%. Every US Census region sits between 56% and 65%.
Western Canada advertises most. US regions sit within ten points of each other.
Share of institutions whose CE unit ran at least one ad · n = 300 institutions, 191 advertising
Canada
United States
Source: CredScape ad collection, October 2026. Institutions whose CE unit ran at least one ad, over institutions in the study. US regions follow the Census Bureau.
Western Canada advertises most; the US is even. 41 of 50 institutions in BC, Alberta, Saskatchewan and Manitoba advertise their CE unit (82%), Ontario 35 of 54 (65%), Atlantic Canada 3 of 13 (23%). In every US Census region, 56 to 65% do. Volume concentrates in the Northeast: 21% of US institutions, 32% of US CE-unit ads. Region tables in A1 and A2.
Finding 4 · Crowded fields
Business is the most crowded field in every region.
Counting the institutions whose CE unit advertised each subject in each region: 29 in the US South run Business ads, 23 in the West. In Ontario, 15 of the province's 35 CE advertisers do.
Business and Data & AI are the crowded fields. Ontario and the US South are the crowded regions.
Institutions whose CE unit ran at least one ad in the subject, by the institution's home region · n = 85 Canadian and 106 US CE advertisers · brand ads excluded
Canada · province
United States · Census region
Source: CredScape ad collection, October 2026. Subject from the ad's classification. Canadian rows are provinces; US rows are Census regions.
The quiet fields are as telling as the crowded ones. Indigenous Knowledge and Culture has 22 ads from 7 institutions across both countries. Dalhousie is Nova Scotia's only CE advertiser, and all 83 of its ads are brand ads. Region is the institution's home, not where the ad was shown.
Finding 5 · Platforms
Canadian CE units use LinkedIn more.
Institutions use Google at about the same rate in both countries. LinkedIn differs: 54% of Canadian institutions with an account ran CE-unit ads there, against 37% in the US.
Canadian CE units use LinkedIn more. Google use is even.
Institutions whose CE unit advertised on the platform, as a share of institutions with an account there
Meta
Source: CredScape ad collection, October 2026. Video shares are Canada only; the US LinkedIn collection holds no video. Video by platform in the interactive version.
LinkedIn is where CE units sell the unit, not the program. Brand ads are 28.5% of LinkedIn CE-unit ads, against 16% on Google and 12% on Meta. CE units rarely use video: on LinkedIn in Canada, 4.3% of CE-unit ads are video, against 23% of the institutions' other ads. 24 of 85 Canadian CE advertisers run no Google CE ads at all.
Finding 6 · What they sell
Business is the largest subject. Data and AI is bigger in the US.
Data Analytics & AI is 17% of US CE-unit ads against 10% in Canada. Canadian CE units devote more of their ads to the unit itself: 26.5% promote the CE brand without naming a subject, against 15.5% in the US.
Business leads in both countries. Data and AI is a bigger share in the US.
Share of CE-unit ads by subject · n = 4,313 Canada, 12,604 United States
Business & Management
Data Analytics & AI
IT & Cybersecurity
Leadership & Communication
Healthcare & Medicine
Arts & Creative
Environment & Science
Languages
Brand, no subject named
Source: CredScape ad collection, October 2026. Brand = ads for the CE unit that name no subject. Subjects below 3% in both countries are omitted here and shown in the interactive version.
Brand advertising is a choice, and schools make it differently. Among the top ten advertisers, brand ads are 61% of Harvard's CE-unit ads and 51% of Toronto Metropolitan's, but 3% of MIT's and none of Johns Hopkins'. The by-school table is A5.
Ads by subject
Arts & Creative

Columbia University
United States · Meta · 238 days

University of Maryland Baltimore County
United States · LinkedIn · 181 days

British Columbia Institute of Technology
Canada · LinkedIn · 120 days

Northwestern University
United States · LinkedIn · 151 days

Stanford University
United States · LinkedIn · 61 days
Business & Management
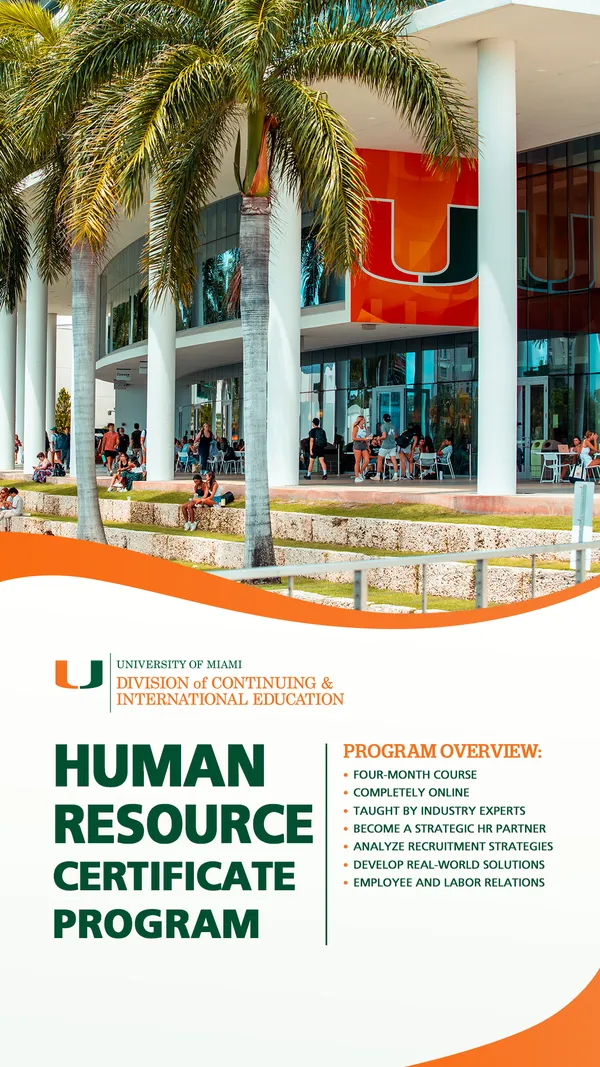
University of Miami
United States · Meta · 493 days

Red River College Polytechnic
Canada · LinkedIn · 123 days

British Columbia Institute of Technology
Canada · LinkedIn · 120 days

Columbia University
United States · Meta · 268 days

HEC Montréal
Canada · LinkedIn · 116 days
Data Analytics & AI

Georgia Institute of Technology
United States · Meta · 402 days

University of British Columbia - Vancouver
Canada · Meta · 128 days

Northwestern University
United States · LinkedIn · 273 days

Massachusetts Institute of Technology
United States · Meta · 244 days

Columbia University
United States · LinkedIn · 242 days
Education & Adult Learning

Toronto Metropolitan University
Canada · LinkedIn · 92 days

University of New Mexico
United States · Meta · 305 days

University of California, Irvine
United States · LinkedIn · 150 days

California State University, Long Beach
United States · LinkedIn · 61 days

The University of Alabama
United States · LinkedIn · 61 days
Environment & Science

Georgia Institute of Technology
United States · Meta · 741 days

Northern Alberta Institute of Technology
Canada · LinkedIn · 61 days

Massachusetts Institute of Technology
United States · Meta · 169 days

Simon Fraser University
Canada · LinkedIn · 59 days

Arizona State University
United States · LinkedIn · 92 days
Health & Wellness
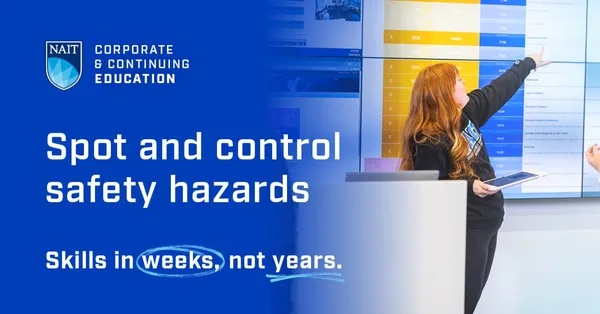
Northern Alberta Institute of Technology
Canada · LinkedIn · 62 days

Georgia Institute of Technology
United States · Meta · 235 days

Kennesaw State University
United States · Meta · 145 days
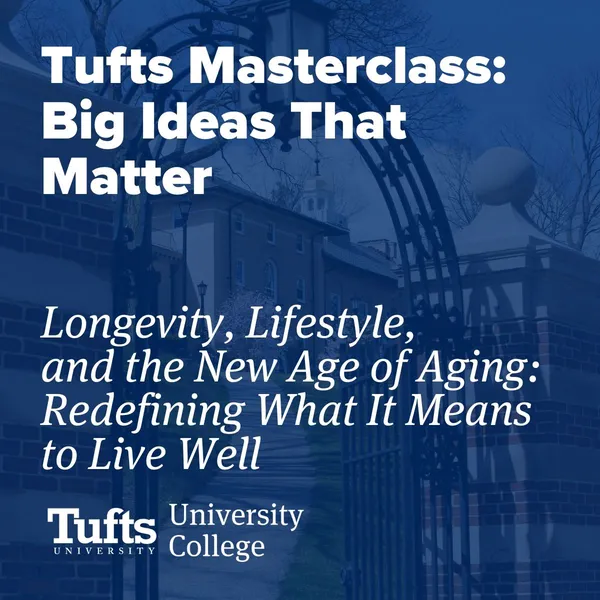
Tufts University
United States · LinkedIn · 120 days

Simon Fraser University
Canada · LinkedIn · 61 days
Healthcare & Medicine

Red River College Polytechnic
Canada · LinkedIn · 123 days

Kennesaw State University
United States · Meta · 632 days

Columbia University
United States · Meta · 261 days

University of British Columbia - Okanagan
Canada · LinkedIn · 85 days

Northwestern University
United States · LinkedIn · 151 days
History, Culture, & Society

Northern Alberta Institute of Technology
Canada · LinkedIn · 121 days

University of Guelph
Canada · LinkedIn · 31 days

Columbia University
United States · Meta · 133 days

University of California, Irvine
United States · LinkedIn · 92 days

University of Wisconsin, Eau Claire
United States · Meta · 86 days
IT & Cybersecurity

University of Massachusetts--Lowell
United States · LinkedIn · 334 days

University of British Columbia - Vancouver
Canada · Meta · 98 days

Georgia Institute of Technology
United States · Meta · 332 days

Northwestern University
United States · LinkedIn · 273 days

Columbia University
United States · Meta · 221 days
Indigenous Knowledge & Culture

University of Calgary
Canada · LinkedIn · 61 days
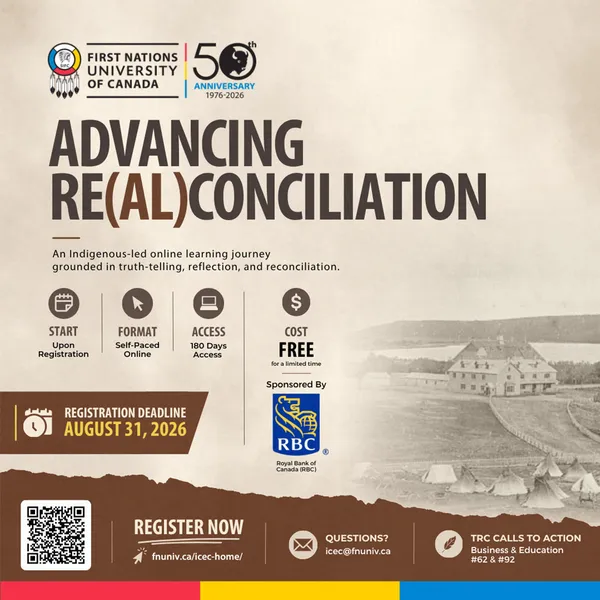
First Nations University of Canada
Canada · Meta · 42 days

University of Northern British Columbia
Canada · LinkedIn · 31 days
Languages

University of Miami
United States · Meta · 402 days

University of British Columbia - Vancouver
Canada · Meta · 38 days

Columbia University
United States · Meta · 274 days

Fleming College
Canada · Meta · 27 days

Kennesaw State University
United States · Meta · 121 days
Leadership & Communication
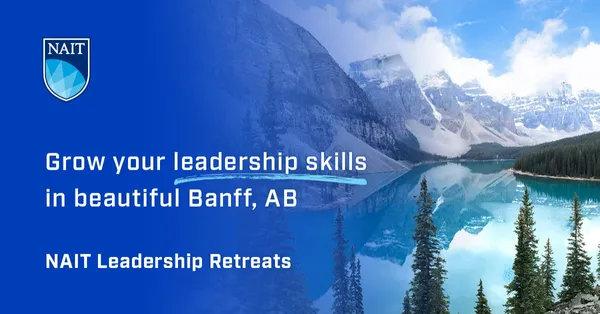
Northern Alberta Institute of Technology
Canada · LinkedIn · 182 days

University of Colorado Boulder
United States · Meta · 294 days

University of Alberta
Canada · LinkedIn · 181 days

Northwestern University
United States · LinkedIn · 273 days

Fanshawe College
Canada · LinkedIn · 90 days
Mental Health & Counselling

Northwestern University
United States · LinkedIn · 181 days

University of Washington
United States · Meta · 102 days

University of Saskatchewan
Canada · LinkedIn · 30 days

Harvard University
United States · LinkedIn · 92 days

Vancouver Island University
Canada · Meta · 13 days
Public & Social Services

University of St. Michael's College
Canada · LinkedIn · 196 days

Simon Fraser University
Canada · LinkedIn · 61 days

University of California San Diego
United States · LinkedIn · 214 days

Justice Institute of British Columbia
Canada · LinkedIn · 61 days

University of Maryland Baltimore County
United States · LinkedIn · 181 days
Trades & Technical

Northern Alberta Institute of Technology
Canada · LinkedIn · 91 days

Kennesaw State University
United States · Meta · 145 days

Massachusetts Institute of Technology
United States · LinkedIn · 89 days

Saskatchewan Polytechnic
Canada · LinkedIn · 61 days

University of Maryland Baltimore County
United States · LinkedIn · 61 days
Brand

Toronto Metropolitan University
Canada · LinkedIn · 181 days

Fanshawe College
Canada · LinkedIn · 153 days

Algonquin College
Canada · LinkedIn · 151 days

Seneca College
Canada · LinkedIn · 151 days

Columbia University
United States · LinkedIn · 242 days
Ads reproduced for commentary and research. Rights remain with the advertisers; contact research@credscape.io to remove one.
Finding 7 · What the ads say
Canada says micro-credential. The US says degree.
"Micro-credential" appears in 4.7% of Canadian CE-unit ads with text and 0.2% of American ones: 123 ads against 12. Degrees and master's programs run the other way, 13% in the US against 3%. Canadian ads also sell flexibility, American ads AI and leadership.
Canada sells micro-credentials and flexibility. The US sells degrees, AI and leadership.
Share of CE-unit ads with readable text that mention each theme · n = 2,630 Canada, 5,278 United States
Flexible or part-time
Leadership or management
AI
Degree or master's
Micro-credential
Info session or webinar
A price
Source: CredScape ad collection, October 2026. CE-unit ads with readable text (47% of all CE-unit ads). Word matching on headline, body and image text. All twelve themes in the interactive version.
Nobody names a rival, and almost nobody names a price. None of the 7,908 ads mentions another provider. 60 show a price, 1 in 132; another 59 show a scholarship or discount amount. Flexible or part-time study appears in 22% of Canadian ads against 10% in the US; AI in 10% of American ads against 6%. Info-session ads are mostly one institution: Simon Fraser runs 158 of Canada's 248.
What the ads say, in the ads
Flexible or part-time

University of Colorado Boulder
United States · Meta · 297 days
University of Alberta
Canada · LinkedIn · 181 days

Northwestern University
United States · LinkedIn · 273 days

University of British Columbia - Vancouver
Canada · Meta · 161 days

Georgia Institute of Technology
United States · LinkedIn · 273 days
AI

University of Massachusetts--Lowell
United States · LinkedIn · 304 days
University of British Columbia - Vancouver
Canada · Meta · 128 days

Northwestern University
United States · LinkedIn · 273 days

Northern Alberta Institute of Technology
Canada · LinkedIn · 121 days

Massachusetts Institute of Technology
United States · LinkedIn · 153 days
Micro-credential
Toronto Metropolitan University
Canada · LinkedIn · 181 days

Tufts University
United States · LinkedIn · 242 days
Seneca College
Canada · LinkedIn · 151 days

Arizona State University
United States · LinkedIn · 61 days

Southern Alberta Institute of Technology
Canada · LinkedIn · 144 days
Degree or master's

University of Massachusetts--Lowell
United States · LinkedIn · 334 days
University of Colorado Boulder
United States · Meta · 297 days

University of Guelph
Canada · LinkedIn · 31 days

Northwestern University
United States · LinkedIn · 273 days
Georgia Institute of Technology
United States · LinkedIn · 273 days
Info session

Simon Fraser University
Canada · LinkedIn · 62 days

Brown University
United States · LinkedIn · 153 days

University of Virginia
United States · LinkedIn · 92 days

Toronto Metropolitan University
Canada · LinkedIn · 61 days
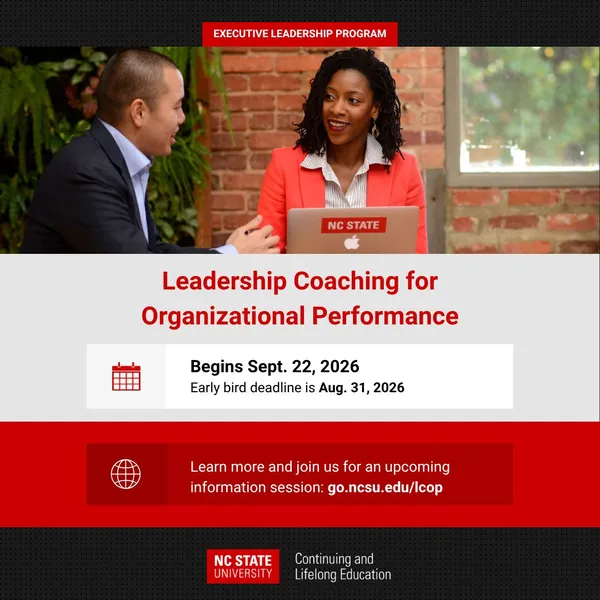
North Carolina State University
United States · LinkedIn · 92 days
Free

Simon Fraser University
Canada · LinkedIn · 62 days

Kennesaw State University
United States · Meta · 95 days

Brown University
United States · LinkedIn · 92 days

University of Guelph
Canada · LinkedIn · 62 days
North Carolina State University
United States · LinkedIn · 92 days
Urgency

Columbia University
United States · Meta · 255 days
Red River College Polytechnic
Canada · LinkedIn · 123 days

Quinnipiac University
United States · LinkedIn · 150 days

Bow Valley College
Canada · LinkedIn · 121 days

Kennesaw State University
United States · Meta · 144 days
A price
Georgia Institute of Technology
United States · LinkedIn · 273 days

Okanagan College
Canada · Meta · 44 days

Columbia University
United States · LinkedIn · 181 days

Algonquin College
Canada · LinkedIn · 43 days

University of Miami
United States · LinkedIn · 181 days
Ads reproduced for commentary and research. Rights remain with the advertisers; contact research@credscape.io to remove one.
Finding 8 · Brand
Always-on advertisers run brand ads alongside program ads.
58 of Canada's 85 CE advertisers and 69 of America's 106 run brand ads: ads for the CE unit that name no subject or program. 30 Canadian and 38 US institutions keep one running every month.
Nearly all always-on advertisers in Canada run brand ads; four in five in the US.
CE advertisers with ads covering every month of the past year, by whether any of those ads are brand ads · n = 39 Canada, 66 United States
Canada · 39 always-on advertisers
United States · 66 always-on advertisers
Brand is a bigger share of Canadian CE advertising.
Median share of a CE unit's ads that are brand ads · advertisers with 20 or more CE-unit ads · n = 35 Canada, 60 United States
24%
Canada · median brand share of a CE unit's ads, advertisers with 20 or more CE-unit ads (n = 35)
10%
United States · median brand share of a CE unit's ads, advertisers with 20 or more CE-unit ads (n = 60)
Source: CredScape ad collection, October 2026. Brand = ads for the CE unit that name no subject or program. "Every month" = the ad's first-to-last date range covers the month.
The advertisers that never go quiet run brand ads alongside program ads. 38 of 39 in Canada, 52 of 66 in the US. Brand ads are shorter-lived than program ads on Google (220 against 500 days median in Canada, 267 against 377 in the US), so staying visible means renewing them.
Does anyone know your unit exists between intakes?
Finding 9 · Always on
Most CE advertisers are visible every month.
Many of these ads run for years. 1,891 CE-unit ads from 65 institutions were still running in October 2026 after starting about two years earlier or more. The oldest, from UC San Diego and UC Berkeley, have run since at least October 2021.
Most CE advertisers had ads running in every month of the past year.
CE advertisers with a CE-unit ad whose first-to-last date range covers every month · n = 85 Canada, 106 United States
46%
Canada · 39 of 85 CE advertisers
62%
United States · 66 of 106 CE advertisers
Median days a CE-unit ad ran, by platform
Source: CredScape ad collection, October 2026. Libraries do not show every day an ad ran. Google dates begin October 2021; Meta lists only ads active at collection, which shortens its durations. Duration buckets in A4.
If you advertise only at intake, your competitors are visible between your campaigns. 92% of Johns Hopkins' 306 running ads started two or more years ago. At the other end, 31 of 191 CE advertisers had nothing running in the 30 days before collection. Half of Google CE-unit ads run longer than a year; a quarter of Meta ads run a week or less.
Formats
Video is 9% of Google CE-unit ads in the US and 8% in Canada; LinkedIn CE ads are almost all static images.

University of Manitoba
Canada · Google · 1,328 days
University of St. Michael's College
Canada · LinkedIn · 196 days
University of British Columbia - Vancouver
Canada · Meta · 161 days

Western University
Canada · Meta · 49 days
Ads reproduced for commentary and research. Rights remain with the advertisers; contact research@credscape.io to remove one.
Your institution
Find your institution
What it takes to compete
Three decisions for CE teams
What the findings change about how a continuing education unit plans its advertising.
Map who advertises your subject in your region.
Business has 29 advertisers in the US South and 15 in Ontario. Some subjects have one advertiser in a province. Your competition is a short, knowable list.
Decide what runs between intakes.
62% of US and 46% of Canadian CE advertisers are visible every month. 30 Canadian and 38 US institutions keep a brand ad running all year. A campaign that stops at intake leaves the months in between to them.
Decide whether your unit exists between intakes.
A brand ad is the one that can run when no program is open. 30 Canadian and 38 US CE units keep one up every month, and nearly every always-on advertiser runs them. If your advertising stops when a program closes, nothing carries your name until the next one opens.
Method
How we did this
| Sources | We collected ads from three public libraries in October 2026: the Google Ads Transparency Center, the LinkedIn Ad Library and the Meta Ad Library. |
|---|---|
| Sample | The sample holds 162,369 unique ads from 300 institutions, 125 in Canada and 175 in the US. We removed duplicates by platform and ad ID. |
| CE units | We identified 292 continuing education units at these institutions. For 230 of them, a quote on the unit's own web page confirmed it. We matched each unit to its advertiser accounts. In all, 16,917 ads came from CE-unit accounts. |
| Classification | Language models labelled each ad. Before they did, they had to reach a precision of at least 0.90 and a recall of at least 0.75 on a test set of 253 ads. |
| Denominators | Institution shares count institutions. Ad shares count ads. The median CE share uses only institutions with 20 or more ads. Text measures use only ads with readable text, which is 47% of CE-unit ads. Each chart states its own denominator. |
| What each platform shows | Google lists ads shown in the last 12 months, and its dates begin in October 2021. Meta lists only ads that were active when we collected. We searched LinkedIn once a month over the past year. "Running in a month" means an ad's first-to-last date range covers that month; the libraries do not show every day an ad ran. |
| Coverage | Our Google collection by domain reached 72 of 165 US institution domains, so Google counts are lower bounds. The US LinkedIn collection holds no video ads, so video shares cover Canada only. An ad counts as long-running if it was first seen on or before 1 November 2024, about two years before collection, and was still running when we collected. |
| Not measured | We did not measure spend, impressions, clicks or enrolments. The ad libraries do not publish them. |
The next edition, in early 2027, adds more US institutions and repeats the count.
Notes on the supplied figures
Theme and subject shares are rounded; count estimates derived from them are approximate. The supplied subject table contains only the displayed subjects. The supplied theme data contains twelve themes; price-only country shares are transcribed from the report copy. US other-campus and company counts are approximate and do not sum exactly to the reported total.
Appendix
Tables
| Province or territory | Institutions | With CE ads | Share |
|---|---|---|---|
| Ontario | 54 | 35 | 65% |
| British Columbia | 26 | 22 | 85% |
| Alberta | 12 | 9 | 75% |
| Manitoba | 8 | 6 | 75% |
| Nova Scotia | 6 | 1 | 17% |
| Quebec | 6 | 4 | 67% |
| Saskatchewan | 4 | 4 | 100% |
| Prince Edward Island | 3 | 1 | 33% |
| New Brunswick | 2 | 1 | 50% |
| Newfoundland and Labrador | 2 | 0 | 0% |
| Yukon | 1 | 1 | 100% |
| Northwest Territories | 1 | 1 | 100% |
Institutions (universities and colleges) in the study, October 2026. With CE ads = the CE unit ran at least one ad. Small provinces carry few institutions; read them as counts. Five Montréal institutions without a province on record are counted in Quebec. Nunavut has no institution in the study.
| Region or state | Institutions | With CE ads | Share |
|---|---|---|---|
| Northeast | 36 | 21 | 58% |
| South | 56 | 35 | 63% |
| Midwest | 43 | 24 | 56% |
| West | 40 | 26 | 65% |
| California | 22 | 14 | 64% |
| Texas | 10 | 5 | 50% |
| Massachusetts | 10 | 6 | 60% |
| New York | 9 | 6 | 67% |
| Illinois | 9 | 5 | 56% |
| Wisconsin | 8 | 4 | 50% |
| Florida | 6 | 5 | 83% |
| Georgia | 6 | 4 | 67% |
| Missouri | 6 | 3 | 50% |
| North Carolina | 6 | 4 | 67% |
| New Jersey | 5 | 2 | 40% |
| Pennsylvania | 5 | 3 | 60% |
Institutions in the study, October 2026. With CE ads = the CE unit ran at least one ad. Census regions first, then states with five or more institutions in the study. Seven states have no institution in the study (AK, ID, KY, ME, ND, VT, WY).
| Institution | CE-unit ads |
|---|---|
| UBC Vancouver | 512 |
| York | 340 |
| Toronto Metropolitan | 321 |
| Simon Fraser | 293 |
| McMaster | 276 |
| McGill | 255 |
| NAIT | 239 |
| Waterloo | 183 |
| Western | 161 |
| Université de Montréal | 147 |
| Institution | CE-unit ads |
|---|---|
| MIT | 1,110 |
| Northwestern | 876 |
| Harvard | 768 |
| Columbia | 669 |
| Georgetown | 590 |
| Johns Hopkins | 529 |
| Kennesaw State | 506 |
| Cornell | 493 |
| San Diego State | 336 |
| University of Chicago | 318 |
| Platform | 7 days or less | 8 to 60 | 61 to 365 | Over a year | n |
|---|---|---|---|---|---|
| 2% | 17% | 31% | 50% | 11,274 | |
| 0% | 62% | 38% | 0% | 3,418 | |
| Meta | 23% | 55% | 21% | 1% | 2,124 |
| Institution | Brand share |
|---|---|
| Harvard (US) | 61% |
| Toronto Metropolitan (CA) | 51% |
| McGill (CA) | 35% |
| Columbia (US) | 25% |
| MIT (US) | 3% |
| York (CA) | 1% |
| Johns Hopkins (US) | 0% |
| Subject | Canada | United States |
|---|---|---|
| Business & Management | 21.6% | 25.1% |
| Data Analytics & AI | 9.9% | 17.3% |
| IT & Cybersecurity | 7% | 7.7% |
| Leadership & Communication | 8% | 6.8% |
| Healthcare & Medicine | 4.2% | 7.6% |
| Arts & Creative | 4.4% | 3.4% |
| Environment & Science | 2.3% | 3.9% |
| Languages | 3.5% | 0.9% |
| Brand, no subject named | 26.5% | 15.5% |
| Theme | Canada | United States |
|---|---|---|
| Online | 36.3% | 31.7% |
| Career or job | 30.3% | 22.2% |
| Certificate | 29.3% | 19% |
| Flexible or part-time | 22% | 9.6% |
| Leadership or management | 18.6% | 26.2% |
| Urgency | 13% | 11.6% |
| Degree or master's | 2.9% | 12.8% |
| Info session or webinar | 9.4% | 2.6% |
| Free | 6.8% | 1% |
| AI | 5.6% | 10.2% |
| Micro-credential | 4.7% | 0.2% |
| A dollar amount | 1.3% | 1.6% |
| A price | 0.8% | 0.7% |
| Platform / scope | CE-unit video / ads | Other video / ads |
|---|---|---|
| LinkedIn · Canada | 58 / 1,356 (4.3%) | 821 / 3,584 (22.9%) |
| Google · both countries | 1,030 / 11,274 (9.1%) | 15,438 / 132,177 (11.7%) |
| Meta · both countries | 306 / 2,124 (14.4%) | 1,108 / 5,785 (19.2%) |
CredScape. (2026). Where continuing education competes: continuing education advertising at 300 institutions in Canada and the United States. CredScape Research, October 2026.
Interactive version of the 2026 report